I built a small agent in Claude Code that asks FortyGuard's Temperature MCP about the heat around 14 elementary schools, measures the shade around each one, and writes a short brief for the schools at the top of the list. Along the way the data nearly misled me three times. Those detours turned out to be the most useful part of the work, so they are in here too.
1The heat is the same everywhere
heatmap, Tuesday 12 August 2025, 15:00 local.satellite.2What does differ is shade
Shade is also the thing a tree programme can change. So the agent ranks schools on canopy, and uses the feels-like temperature only to break ties.
3The data I almost trusted
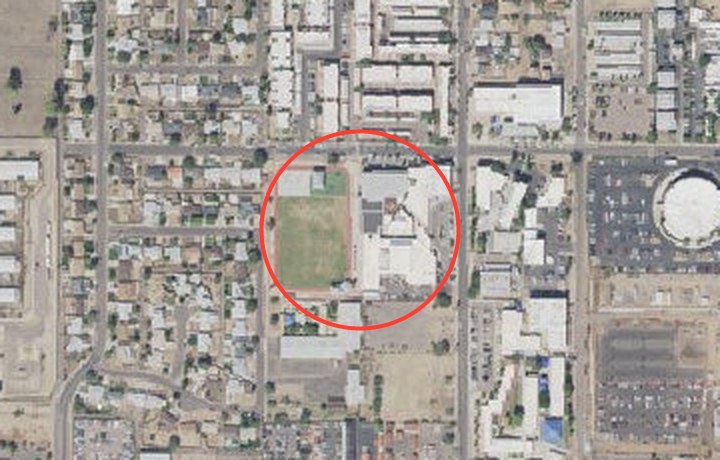
FortyGuard's satellite tool estimates what covers the ground around a point, and my first ranking used it. Then I looked at aerial photos of every school with its 100 m circle drawn on. Wilson Elementary was the clearest case.
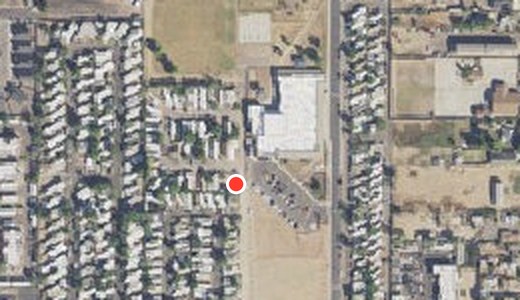
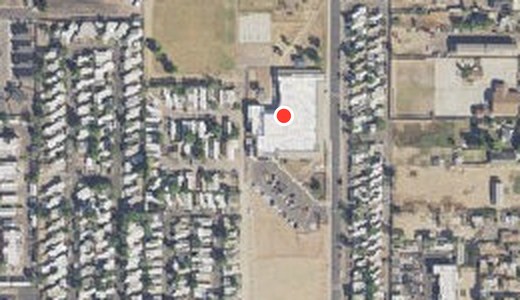
The photos caught a second problem, this one in my own inputs. Moya Elementary's map point, taken from OpenStreetMap, sat in the mobile-home park next door. I moved it onto the school and collected its data again; the first set is kept in the repository.
The third detour was simpler. FortyGuard's heatmap failed for the area around Hopi Elementary in Arcadia on three separate attempts, so that school is left out rather than ranked on missing data.
4The shortlist
Ranked by least canopy, these are the schools to visit first. The five are close to one another, so treat them as a group rather than a strict order; Lookout Mountain is clearly the lowest. Select any school to see it from above with its 100 m circle, and every number with a link to the data it came from.
| # | School | Tree canopy | Feels like |
|---|
5How it's built
The agent runs in Claude Code, connected to FortyGuard's Temperature MCP. The method is written down as a Claude Code skill, so it can be rerun for other U.S. schools, dates or cities by asking for it.
For each school it requests a heatmap at the bell and reads it back with heatmap_read. It then passes FortyGuard's own temperature into env_params to get the feels-like figure, so nothing in that chain is guessed. Finally, satellite provides the land-cover estimate. A small Python client saves every reply, with the exact request, to an evidence folder. A checker then reads every brief and fails it if any number is missing a source or doesn't match the saved reply.
- The code, evidence files and checker
- One-page summary for a programme panel and school briefs
- Notes for the FortyGuard team: bugs, documentation gaps and suggestions found while building this
6What this can't tell you
- The canopy map uses imagery from early 2020. Some campuses have been rebuilt or replanted since, so the list is a shortlist for a site visit, not a verdict.
- Canopy is measured within 100 m of each school's point. That is shade at the gate, not along every route home.
- The ranking uses one weekday afternoon, 12 August 2025, when Arizona's early-starting schools were back; I did not check each district's calendar. The 138-hour figure covers one school.
- Feels-like is the weather provider's apparent temperature on a coarser grid, so neighbouring schools often share a value.
- This is an independent study. It is not affiliated with the City of Phoenix, Canopy for Kids or any school district.